 Building the OpenADMET Data Engine
Building the OpenADMET Data Engine
For those new to OpenADMET, we are an open-science consortium dedicated to building predictive models of safety and toxicity for small molecules to improve humanity’s ability to more reliably, cheaply, and effectively treat disease. We aim to achieve this by developing new assays, datasets, benchmarks, and competitions for ADMET, much as CASP did for protein folding 1.
Our recent ExpansionRx Challenge highlighted a critical gap: among 370 participants, the top four winners relied on proprietary data. This is not surprising as public ADMET datasets are sparse, poorly documented/controlled, noisy, and contradictory 2. Worse, the decisions made during data generation are often opaque or explicitly hidden. This creates a “black box” in which ML practitioners must guess the quality, context, and limitations of the inputs, which means combining data from mismatched assay sources often degrades performance rather than improve it.
OpenADMET is developing a scaled and consistent data engine to support predictive ADMET models. We are applying the technologies and rigor of target-based drug discovery to the mechanisms underlying ADMET properties, starting with metabolism. Octant is a small molecule drug discovery company that has built a platform to measure the interface between biology and chemistry at scale. As a founding member of OpenADMET, Octant is leveraging this infrastructure to build diverse, dense, and self-consistent ADMET datasets. More importantly, we don’t see data generation as a “black box” service, but as a “glass box” collaboration. We aim to establish a tight feedback loop among experimentalists, data scientists, and ML practitioners to ensure the assays, datasets, benchmarks, and competitions are as useful as possible. We are hoping you, the community, can help us improve, and are looking for some feedback.
Our first data release
In this post, we are releasing a preview of our first datasets generated at Octant for OpenADMET: CYP inhibition and reaction phenotyping.
We prioritized metabolism assays because they are among the most critical determinants of both a drug’s exposure and ADMET liabilities. Cytochrome P450 (CYP) enzymes are the workhorses of phase I drug metabolism 3, driving the oxidation of nonpolar xenobiotics into polar intermediates. Consequently, CYP inhibition is a major driver of drug-drug interactions (DDIs) and is intimately linked to complex, interrelated metabolic phenomena (e.g., PXR induction of CYP3A4 4).
To validate our data generation platform, we screened approximately 1,200 compounds for both CYP reactivity (CYP2J2 and CYP3A4) and CYP inhibition (CYP3A4). Crucially, we aimed to improve cost, capacity, and confidence simultaneously by miniaturizing reaction volumes, introducing robust controls, and replacing standard LC-MS with acoustic ejection mass spectrometry (Echo-MS) for reactivity.
Details of our design decisions are provided in the sections below, and a snapshot of the data is shown in Figures 1, 2, and 3. While this is just a teaser dataset in anticipation of a future blind challenge, it is, to our knowledge, one of the largest publicly-available internally consistent CYP datasets. The full dataset is available on GitHub and HuggingFace and includes the following:
Dataset 1: CYP Reaction Phenotyping
Determination of which CYP enzymes metabolize a drug candidate by testing against individual recombinant CYP enzymes
- Targets: CYP3A4 and CYP2J2
- Scale: 1,221 compounds from a diversity chemical library
- Data: Well-level observed peak areas and calculated depletion ratios.
Dataset 2: CYP Inhibition
- Targets: CYP3A4
- Scale: 1,343 compounds (12-point dose-response curves), intersecting highly with the compounds assayed for reaction phenotyping.
- Assay Conditions: These data were collected following a 30 minute pre-incubation with active CYP3A4 to capture inhibition by both parent molecule and any metabolites generated.
- Data: Well-level fluorescence values, calculated IC50 values, and curve-fit statistics.
Note: Our platform also captures raw data artifacts, such as mzML spectra from the mass spectrometer. To keep the repository accessible, we have not included these large files in the initial release. However, if you believe raw spectral features would improve your modeling, please let us know. We are happy to provide them in future releases.
The data show a rich set of active molecules measured against the 3 reactivity and inhibition endpoints. For CYP reactivity, we observe 750 molecules (~61 %) that are depleted >50% in the CYP3A4 reactivity assay (Fig 1A, 1B), and 166 (~13 %) for CYP2J2 (Fig 1C, 1D). The larger set of active molecules for CYP3A4 is consistent with its well-known broad substrate recognition. For our first evaluation of CYP inhibition only, we included a CYP3A4 preincubation step prior to the inhibition assay to capture inhibition effects by both parent molecules and any generated metabolites. As a consequence, the IC50 values reported here reflect the combined effect of reversible inhibition and any time-dependent processes that occur during preincubation, rather than reversible inhibition alone. Using this approach, we identify 1095 molecules (79 %) with detectable inhibition (IC50 < 100 µM) (Fig 1E).
Figure 1: CYP screening overview
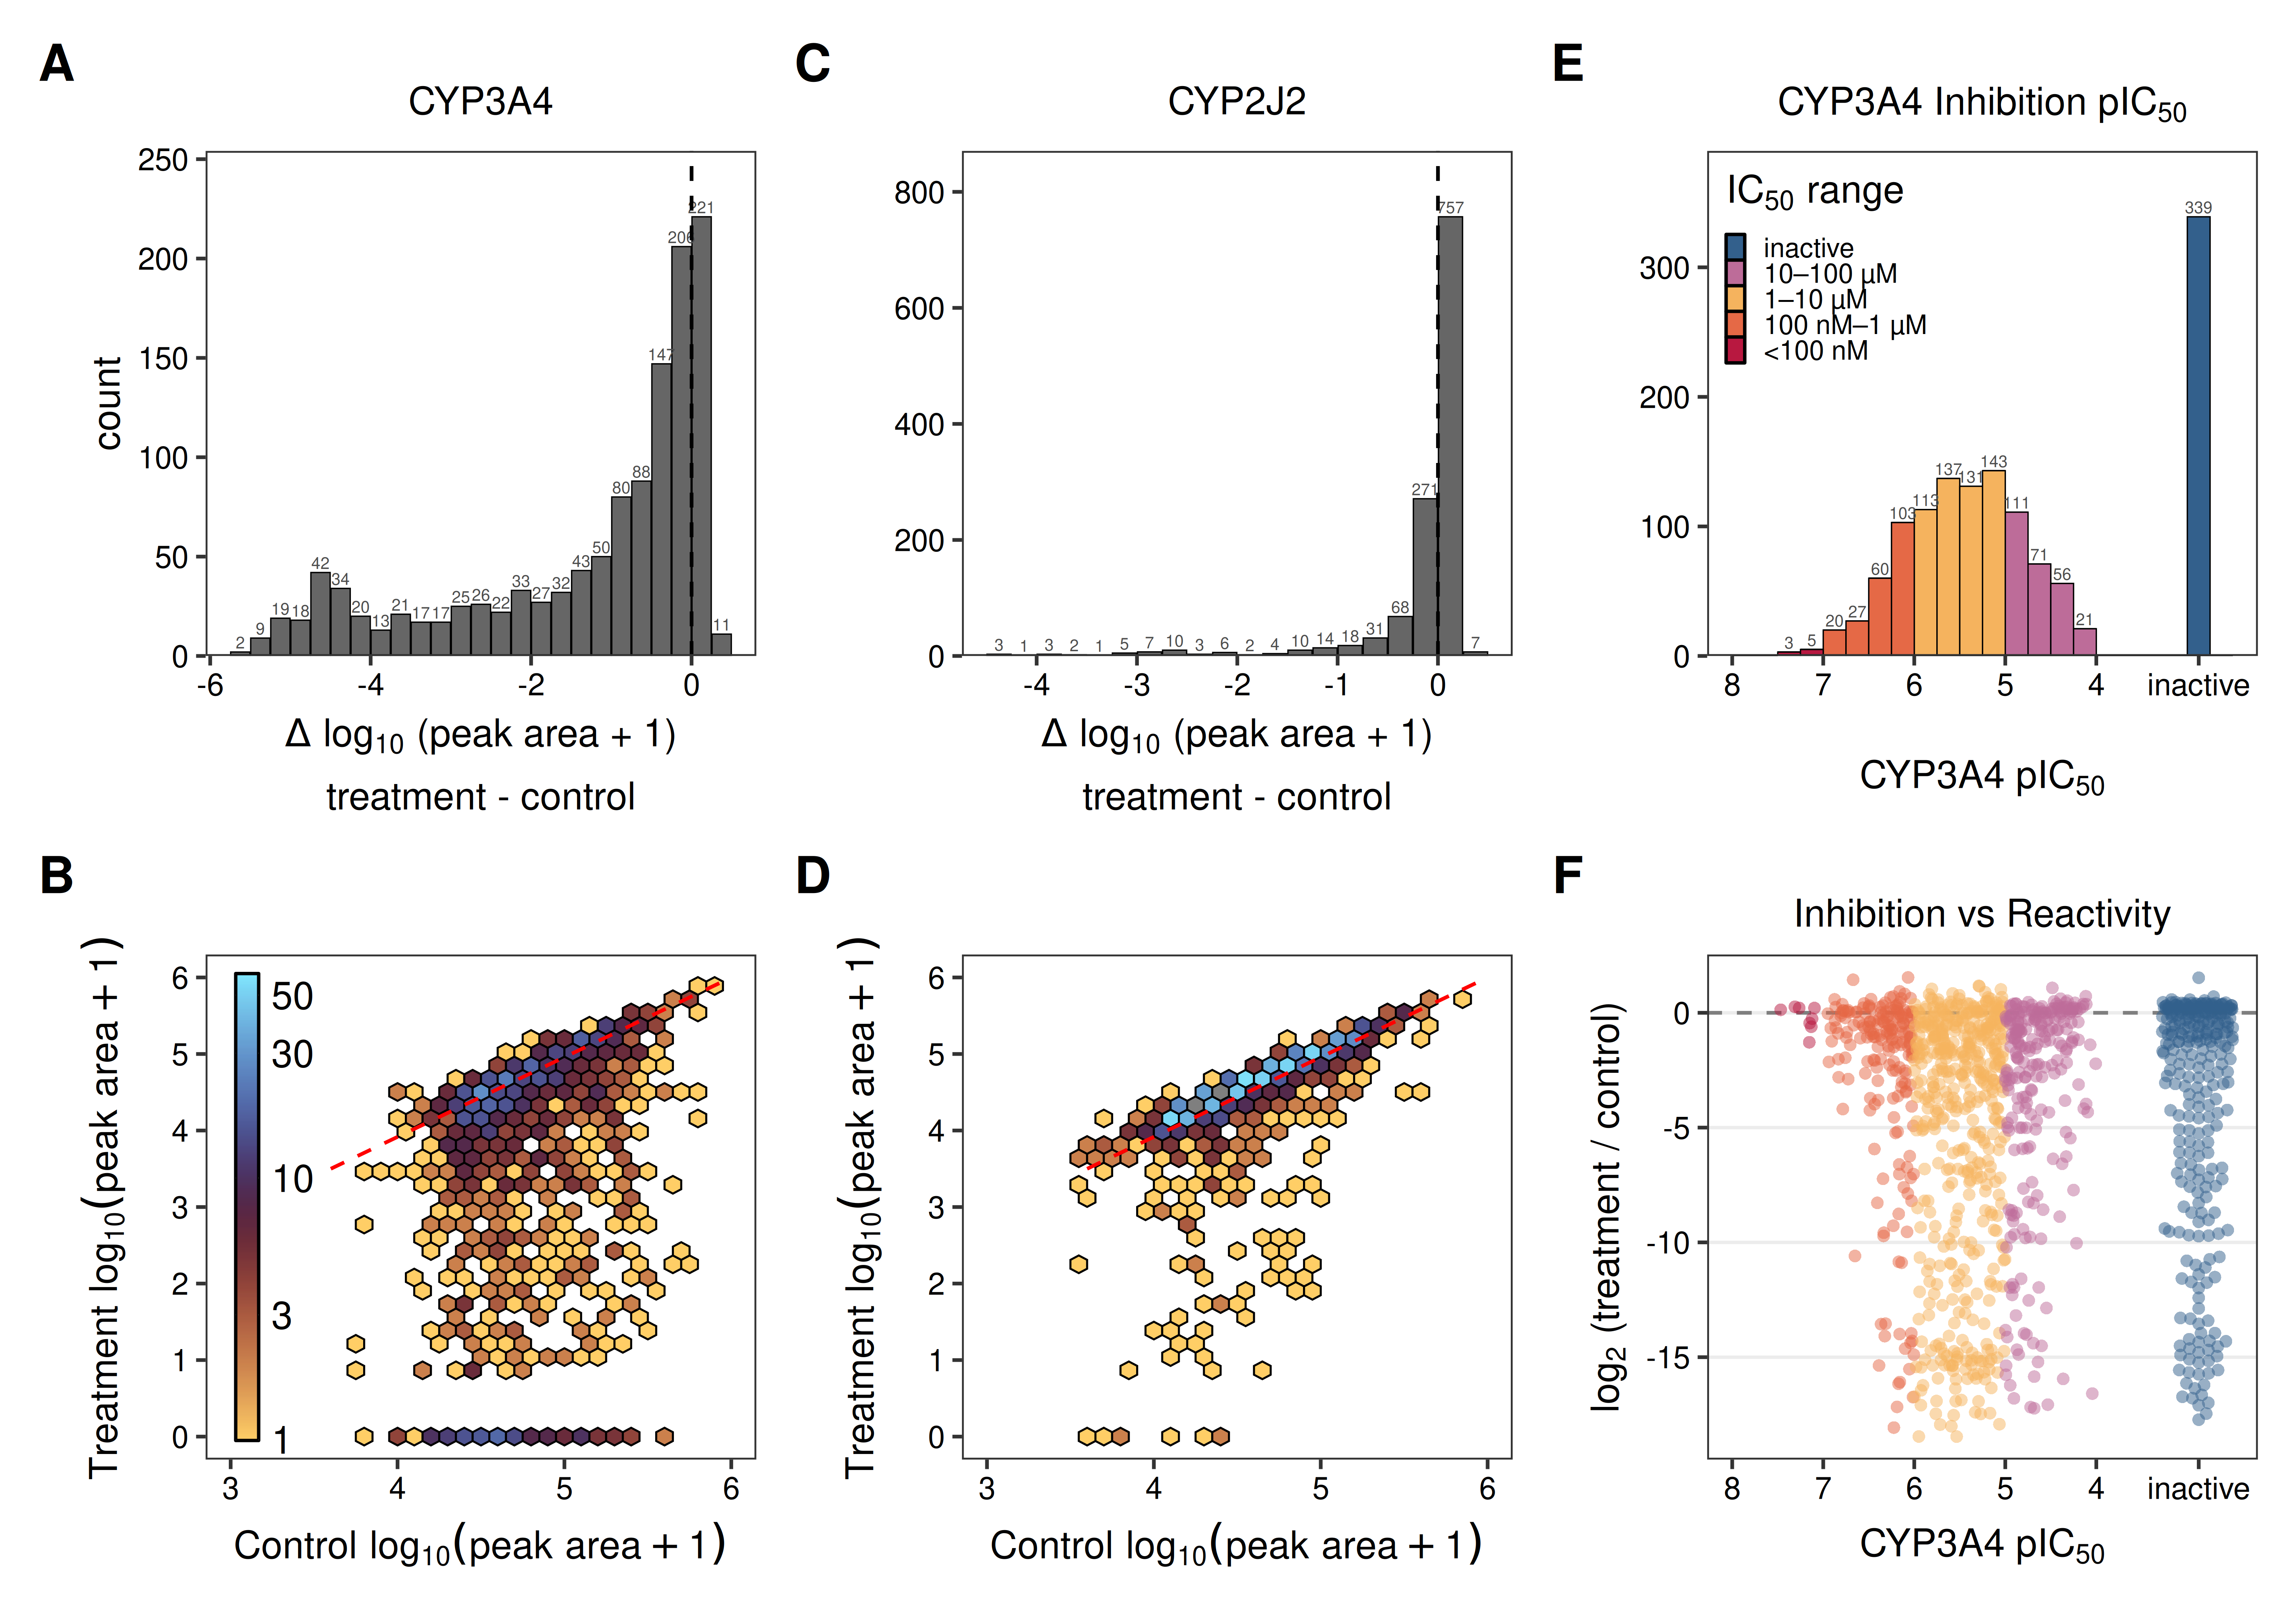
Figure 1: CYP reactivity and inhibition screening overview. (A, C) Distribution of log₁₀ fold-change in peak area (treatment vs control) for reactivity with CYP3A4 (A) and CYP2J2 (C) across the compound library. Dashed line indicates no change. (B, D) Hexbin density plots of reactivity data comparing log₁₀ peak area in control vs treatment conditions for CYP3A4 (B) and CYP2J2 (D). Each bin is colored according to the number of molecules captured within. Red dashed line indicates the line of identity (no-change). (E) Distribution of CYP3A4 pIC₅₀ values from the inhibition assay, colored by IC₅₀ potency bin. (F) CYP3A4 reactivity (log₂ fold-change) as a function of inhibition potency (pIC₅₀), colored by IC₅₀ bin.
Staying true to our ‘glass box’ approach, we surface well-level data, as shown in Figure 2 below. This enables exploration not only of the chemical diversity of compounds with variable degradation, but also understanding how each of the four replicates for each condition performs.
Figure 2: CYP3A4 vs CYP2J2 reactivity
Figure 2: Interactive comparison of CYP3A4 vs CYP2J2 reactivity. Each point represents a single molecule, and marginal density curves show the distributions for each enzyme. Hover to view molecular structure and raw peak area swarm plots per compound.
Taking this further, comparing molecules’ CYP3A4 inhibition with reactivity provides additional context and a more complete picture of the underlying assays (Fig. 1F, Fig. 3). Compounds that fail to inhibit CYP3A4 are rarely substrates, consistent with a lack of binding affinity. Conversely, potent inhibitors often exhibit modest reactivity, indicating binding modes that enable occupancy, but not catalysis within the active site. Some of these potent inhibitors are possibly time-dependent, given the active CYP pre-incubation step. These nuanced relationships are often invisible in public datasets where measurements are aggregated from disparate sources. By capturing self-consistent, multi-endpoint data, we enable the kind of multi-task modeling required to generalize up the complexity stack; from recombinant enzymes to microsomes, hepatocytes, and eventually, in vivo behavior.
Figure 3: CYP3A4 inhibition vs reactivity
Figure 3: Interactive CYP3A4 inhibition potency vs reactivity graph. Each point represents a compound plotted by IC50 (x-axis, log scale) and percent remaining in the CYP3A4 reaction phenotyping assay (y-axis). Marginal densities shown along each axis. Hover to view molecular structure, raw peak area swarm plot, and dose-response curve per compound.
The following sections detail the specific trade-offs we faced in building these assays. For an immediate deep dive into the full protocols and data, including both summary statistics and well-level readouts, please refer to this Github repo and HuggingFace dataset.
Importantly, this is just the start of a large-scale data generation campaign across these and other endpoints. Watch for an announcement in the next 2 weeks for an OpenADMET challenge using Octant-generated data.
Assay Design and Optimization: Navigating Constraints
To reliably model CYP-mediated clearance and drug-drug interactions (DDI), we must understand both how a drug inhibits enzymes and how it is metabolized by them, including the complex feedback loops between the two (e.g., time-dependent inhibition 5). We are building datasets to cover the seven most common CYP isoforms (CYP1A2, CYP2B6, CYP2C8, CYP2C9, CYP2C19, CYP2D6, and CYP3A4), starting with CYP3A4. We also prioritized CYP2J2 early in development as a proof of concept, given its role in extra-hepatic clearance, growing awareness of its importance in drug-induced cardiotoxicity 6, and the relative paucity of public data.
Assay development is a multiparameter optimization problem. Designing experimental cascades that capture high-quality ADMET data at scale requires balancing the inherent tension between Cost, Capacity, and Confidence. Every data point has a cost in time, money, and accuracy. The challenge is to maximize scientific value while minimizing that overhead.
Cost: The Economics of Data Abundance
Generating data at a scale useful for machine learning requires a radical shift in economics. Machine learning is inherently data-hungry, and the loss curve, which describes model error as a function of data collected, is steepest at the beginning 7: scaling from hundreds to tens of thousands of data points provides significant gains in model performance.
Standard CRO assays, however, are designed for lead optimization where chemists refine a focused series and are willing to pay a premium for a handful of data points. But systematically surveying the “avoidome” 8 (the vast chemical space of molecules that interact with antitargets) requires thousands of assay-compound pairs for each target. At standard CRO prices, this is a non-starter. To make this tractable, we set a target of reducing the cost per data point by 100x.
Starting with the CYP enzyme source, we selected the industry-standard Gentest Supersomes (DLS) to ensure reproducible results. To achieve our cost targets without sacrificing this biological quality, we had to fundamentally change the physics of the assay:
- For Inhibition: We chose fluorescence for its speed and simplicity. By leveraging our existing automation, we miniaturized the assay to a 4 µL, 1536-well format. This reduced reagent consumption by 80% relative to a 384-well scale assay, and increased our throughput 4-fold.
- For Metabolism (Reaction Phenotyping): Measuring depletion requires label-free detection, typically via LC-MS. Standard LC-MS is slow (minutes per sample). To bypass this bottleneck, we leveraged acoustic ejection mass spectrometry using a SCIEX Echo MS+ 9, which allows for contactless sampling directly from assay plates on the sub-2 second timescale 10. With this approach, we developed a 2 µL, 1536-well metabolism assay for the Echo-MS at a cost comparable to our CYP inhibition assay.
However, operating at this low microliter scale sacrifices the more forgiving granular visibility and control of standard bench science, where considerations such as sample evaporation or dispense accuracy are less of a concern. Driven by the physical requirements of the instrumentation, we found ourselves navigating a chain of interdependent chemical and operational constraints to capture robust data across thousands of compounds:
- Ionization Efficiency: We use untargeted Time-of-flight (TOF-MS) to avoid the overhead of designing thousands of specific methods. But the hard reality is that not every molecule ionizes equally well under generic conditions. Standard workflows often circumvent this by tweaking parameters for every compound, but operating at OpenADMET’s scale makes individual optimization impractical. Instead, we acknowledge the constraint by pre-profiling every library to identify MS-compatible molecules. This effectively blinds us to a subset of chemical space, but ensures that the signal we do report is real rather than forced. (Note: We are actively working to expand this window; see the ‘Confidence’ section below.)
- Evaporation-Solubility-Activity Interdependencies: In a 1536-well plate, surface-area-to-volume ratios are high. During the hour-long acquisition times, we initially lost ~50% of sample volume to evaporation. We solved this by boosting the quench buffer to 70% DMSO to lower the vapor pressure (Fig 4A). However, this created a new problem: the high solvent concentration caused the salts in our standard reaction buffer to precipitate (“crash out”). We couldn’t simply remove the salts, as the enzyme requires a specific ionic environment to function. We had to thread the needle, identifying a lower ionic strength buffer (10 mM KPO4 / 10 mM MgCl2) that prevented precipitation and maintained CYP3A4 activity (Fig 4B).
- Multiplexing: Mass spectrometry is inherently serial. To make the economics work, we were opportunistic with the “dead space” in the mass spectrum. By pooling 7 compounds into our negative control wells, we exploit the high resolution of the TOF-MS to measure multiple parent signals from a single well. Since these wells only measure parent compound signal, there is no risk of spectral interference, increasing our overall throughput by 75% - a necessary step to prevent instrument time from becoming a bottleneck (Fig 4C).
Figure 4: CYP assay development
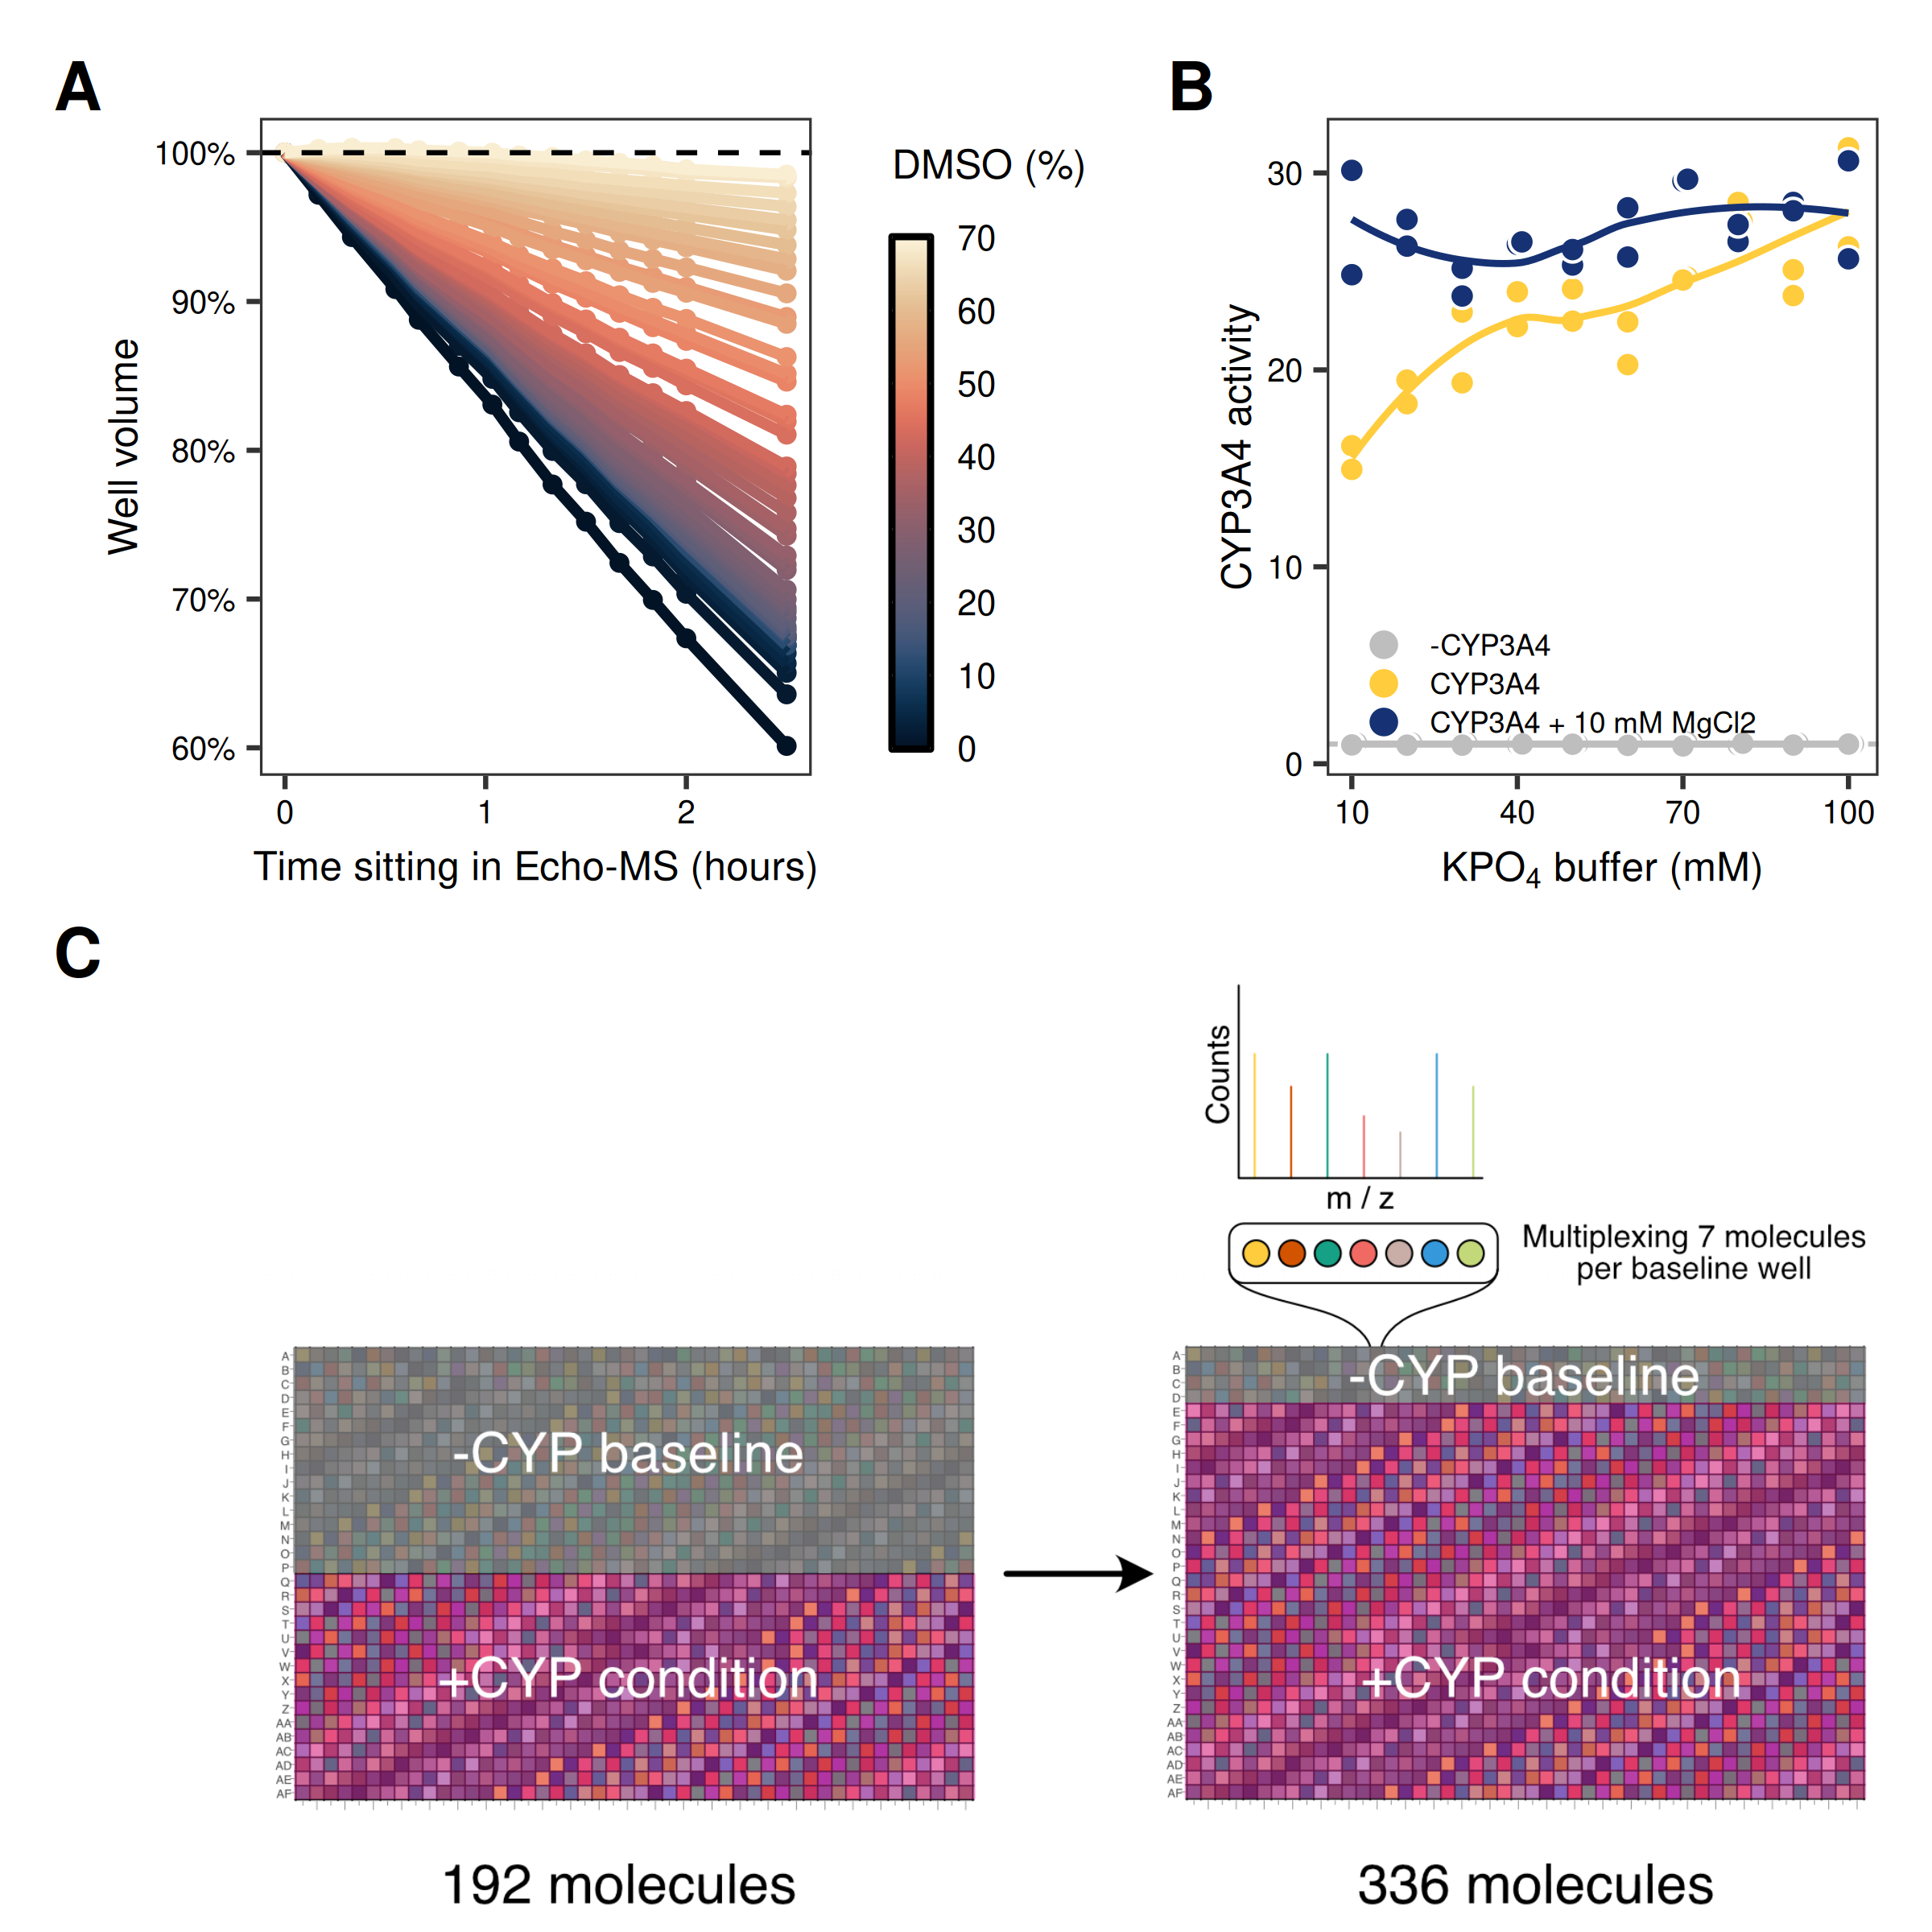
Figure 4: Key steps in CYP assay development. (A) Well volume loss over time in the Echo-MS acoustic ejection system as a function of DMSO concentration (0–70%). (B) CYP3A4 enzymatic activity as a function of potassium phosphate buffer concentration, with and without 10 mM MgCl2 supplementation. CYP3A4 activity measured using fluorogenic substrate DBOMF. (C) Pooling of compounds with no spectral overlap in baseline control wells to increase Echo-MS throughput by 75%.
Capacity: Solving for Breadth vs. Depth
Even with the cost barrier lowered, assay design faces a hard physical limit: capacity. There is a finite number of samples that can be assayed on our instruments each day.
In traditional drug discovery, the goal is to find a hit, a needle in a haystack, and negative data is mostly uninformative. In contrast, our goal is to train a model. That flips the value of negative results. Akin to a game of Minesweeper, we need to confidently map where the mines aren’t in order to navigate chemical space safely, avoiding antitargets. A molecule confirmed clear of a given endpoint is just as valuable as a positive hit as it helps define the boundary of the ‘avoidome’.
If we generated many-point dose-response curves for every compound screened, we would exhaust our capacity on a small slice of chemical space. If we only ran single points, we would lack the mechanistic resolution needed for reliable predictions. The question is how to broadly survey chemical space while still generating depth where it matters. To balance these competing needs, we adapted the tiered screening approach common in lead discovery, but optimized it for dataset generation rather than improving a hit compound.
- Tier 1 (Breadth & Negatives): A first single-point screen maximizes coverage across chemical space. The primary goal here is to identify and categorize the “negatives” cheaply and effectively, mapping the safe regions of chemical space while flagging potential liabilities, and identify active molecules for further characterization.
- Tier 2 (Depth & Mechanism): Compounds that flag as “active” in Tier 1 are promoted to secondary assays. Here, we allocate additional capacity to capture more detailed activity metrics (kinetics or potency) needed for reliable modeling.
Crucially, the ‘shape’ of this funnel changes depending on the physics of the biological question. For CYP Inhibition:
- Tier 1: A single-concentration screen (typically 30 µM) to measure percent inhibition, using a reporter molecule that is rendered fluorescent by CYP metabolism. We perform this screen following a 30 minute pre-incubation with active CYP to also capture time-dependent inhibitors.
- Tier 2: ‘Hits’ are promoted to a 12-point Dose-Response Curve (DRC) to determine an IC50 estimate. In the future, we will also include a time-dependent inhibition dose response experiment, see the ‘What’s next?’ section below.
For CYP Reactivity:
- Tier 0 (Amenability): Pre-profiling libraries on Echo-MS to filter out poorly ionizing molecules.
- Tier 1 (Phenotyping): A binary reaction phenotyping 11 screen. Is the compound a substrate for this enzyme, measured at a single time-point? (Yes/No).
- Tier 2 (Clearance): Confirmed substrates are moved to a clearance assay where substrate depletion is measured across multiple time points to calculate intrinsic clearance and half-life. Note: This clearance assay is currently under development and will be detailed in a future post.
At our current operational cadence, the mass spectrometer remains the primary bottleneck despite the rapid progress in the field. We currently run the Tier 1 screen at a rate of 1 plate (approx. 330 compounds with 4 replicates) per hour. By filtering out the non-interacting molecules in Tier 1, we preserve precious Tier 2 bandwidth for the compounds that actually require mechanistic characterization.
Confidence (Quality & Context)
A single IC50 value looks clean and definitive — but behind it lies a long chain of experimental decisions, each of which is a potential source of variance or bias. Peeling back that abstraction is essential: a modeler who only sees summary statistics has no way to distinguish a noisy measurement from a true outlier, or a plate artifact from a biological effect.
At 1536-well density, systematic spatial artifacts — edge effects or liquid dispensing patterns — can mask or distort biological signals (Fig 5). For dose-response data, curve fitting decisions like Hill slope constraints or Emin assumptions can meaningfully shift IC50 values. This is where statistical modeling can help ensure data quality. For example, when experimental data is fit to a model like a dose-response curve, the residuals, or how far each point falls from its ‘expected’ value, can identify outliers for exclusion (Fig 5A). Residuals can be further aggregated spatially to identify edge effects (Fig 5B), or visualized as a heatmap to reveal issues with liquid dispensing (Fig 5C). Rather than obscuring these details, we share well-level data, plate maps, and fitted parameters alongside quality annotations, so modelers can apply their own criteria rather than being forced to trust ours. Additionally, close collaboration between experimentalists and data scientists informs the assay design process, letting us use empirical data to guide robust experimental design. For example, power calculations performed on our Tier 0 Echo-MS chemical profiling indicated that 4 biological replicates were sufficient to detect a 50% decrease in abundance at 95% power.
Figure 5: Built-in quality checks
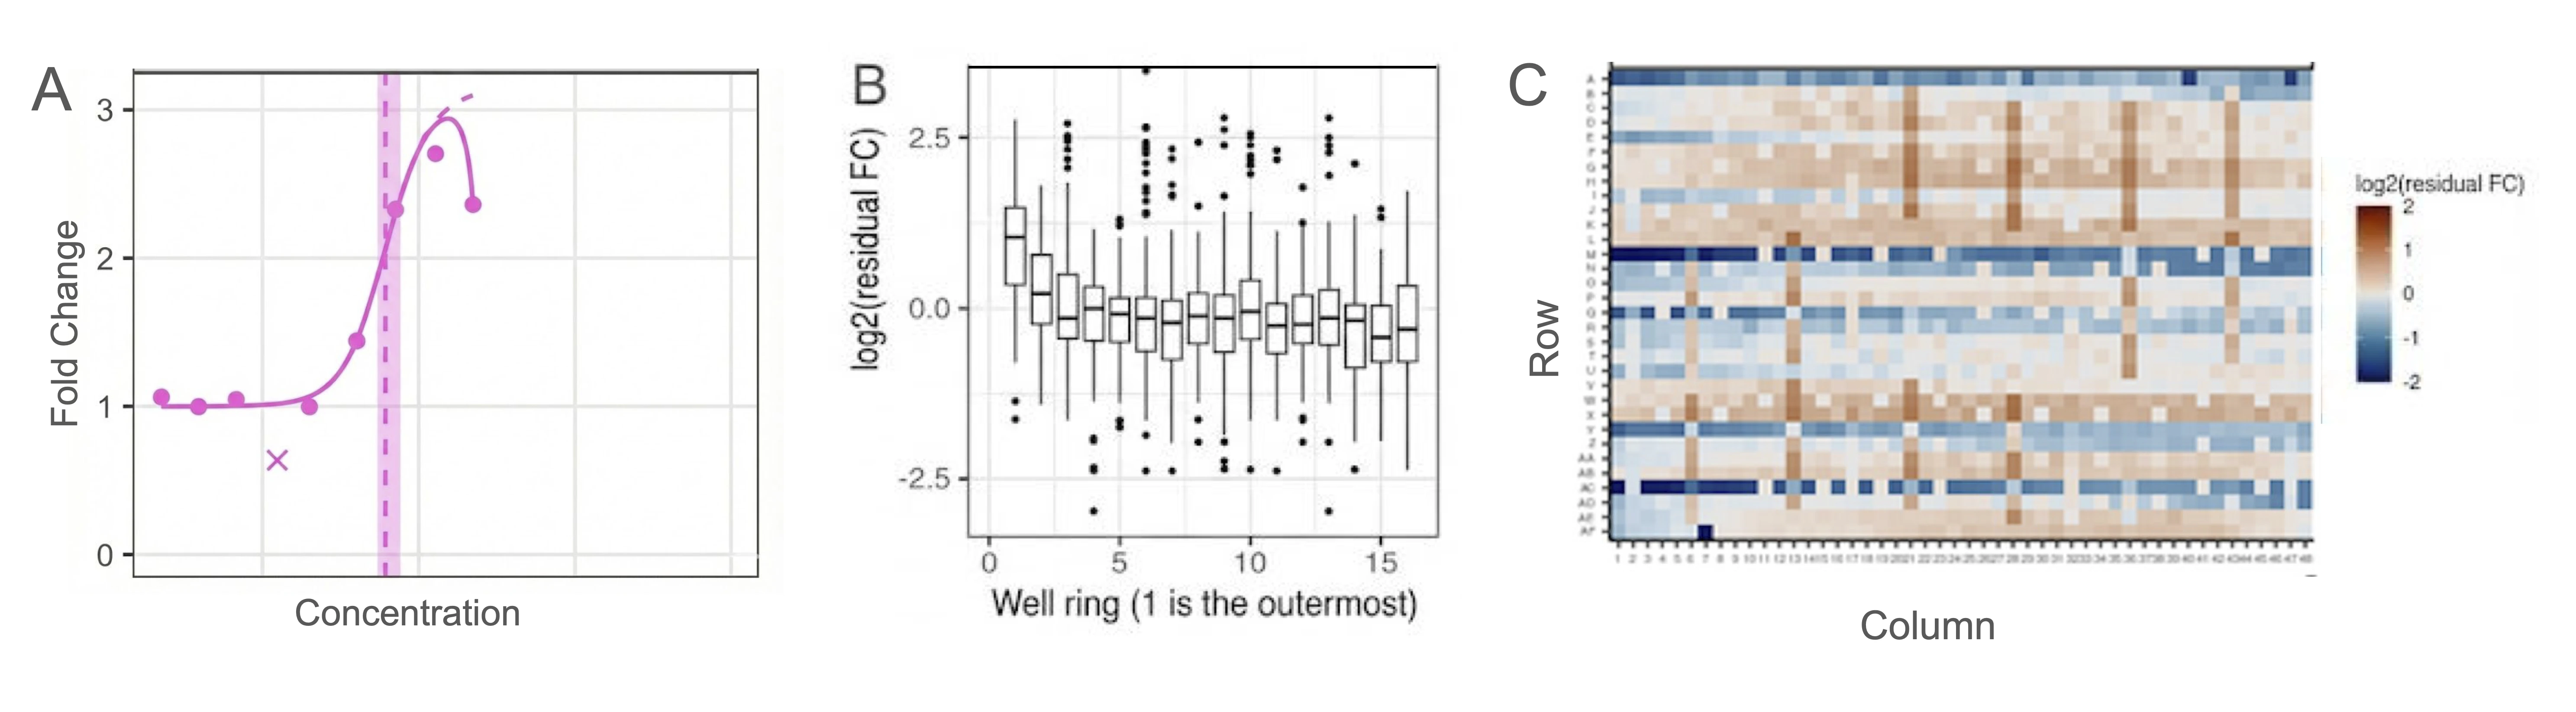
Figure 5: Quality control approaches. (A) Automated detection of outlier point, shown as ‘x’, from representative dose-response curve data. (B) Detection of plate edge-effects in distribution of log2 residual fold-changes by well ring position (1 = outermost), assessing positional plate effects. (C) Heatmap of log2 residual fold-change across plate rows and columns to identify spatial artifacts.
Equally important is ensuring our datasets cover a representative sample of chemical space with minimal bias. In untargeted MS detection, not every molecule ‘flies’ equally well — necessitating the pre-filtering. To avoid these false negatives, we pre-profile every library without enzyme. In our initial 11,000-member library, ~50% of compounds passed this filter when ammonium formate 12 was used as the carrier solvent. Switching to 1 mM ammonium fluoride 10 expanded coverage to ~75%, reducing the ‘blind spots’ in our datasets (Fig 6). We will discuss our ongoing efforts to maximize our coverage of chemical space using methods such as negative mode ionization in a future blog post.
Figure 6: Expanding chemical coverage
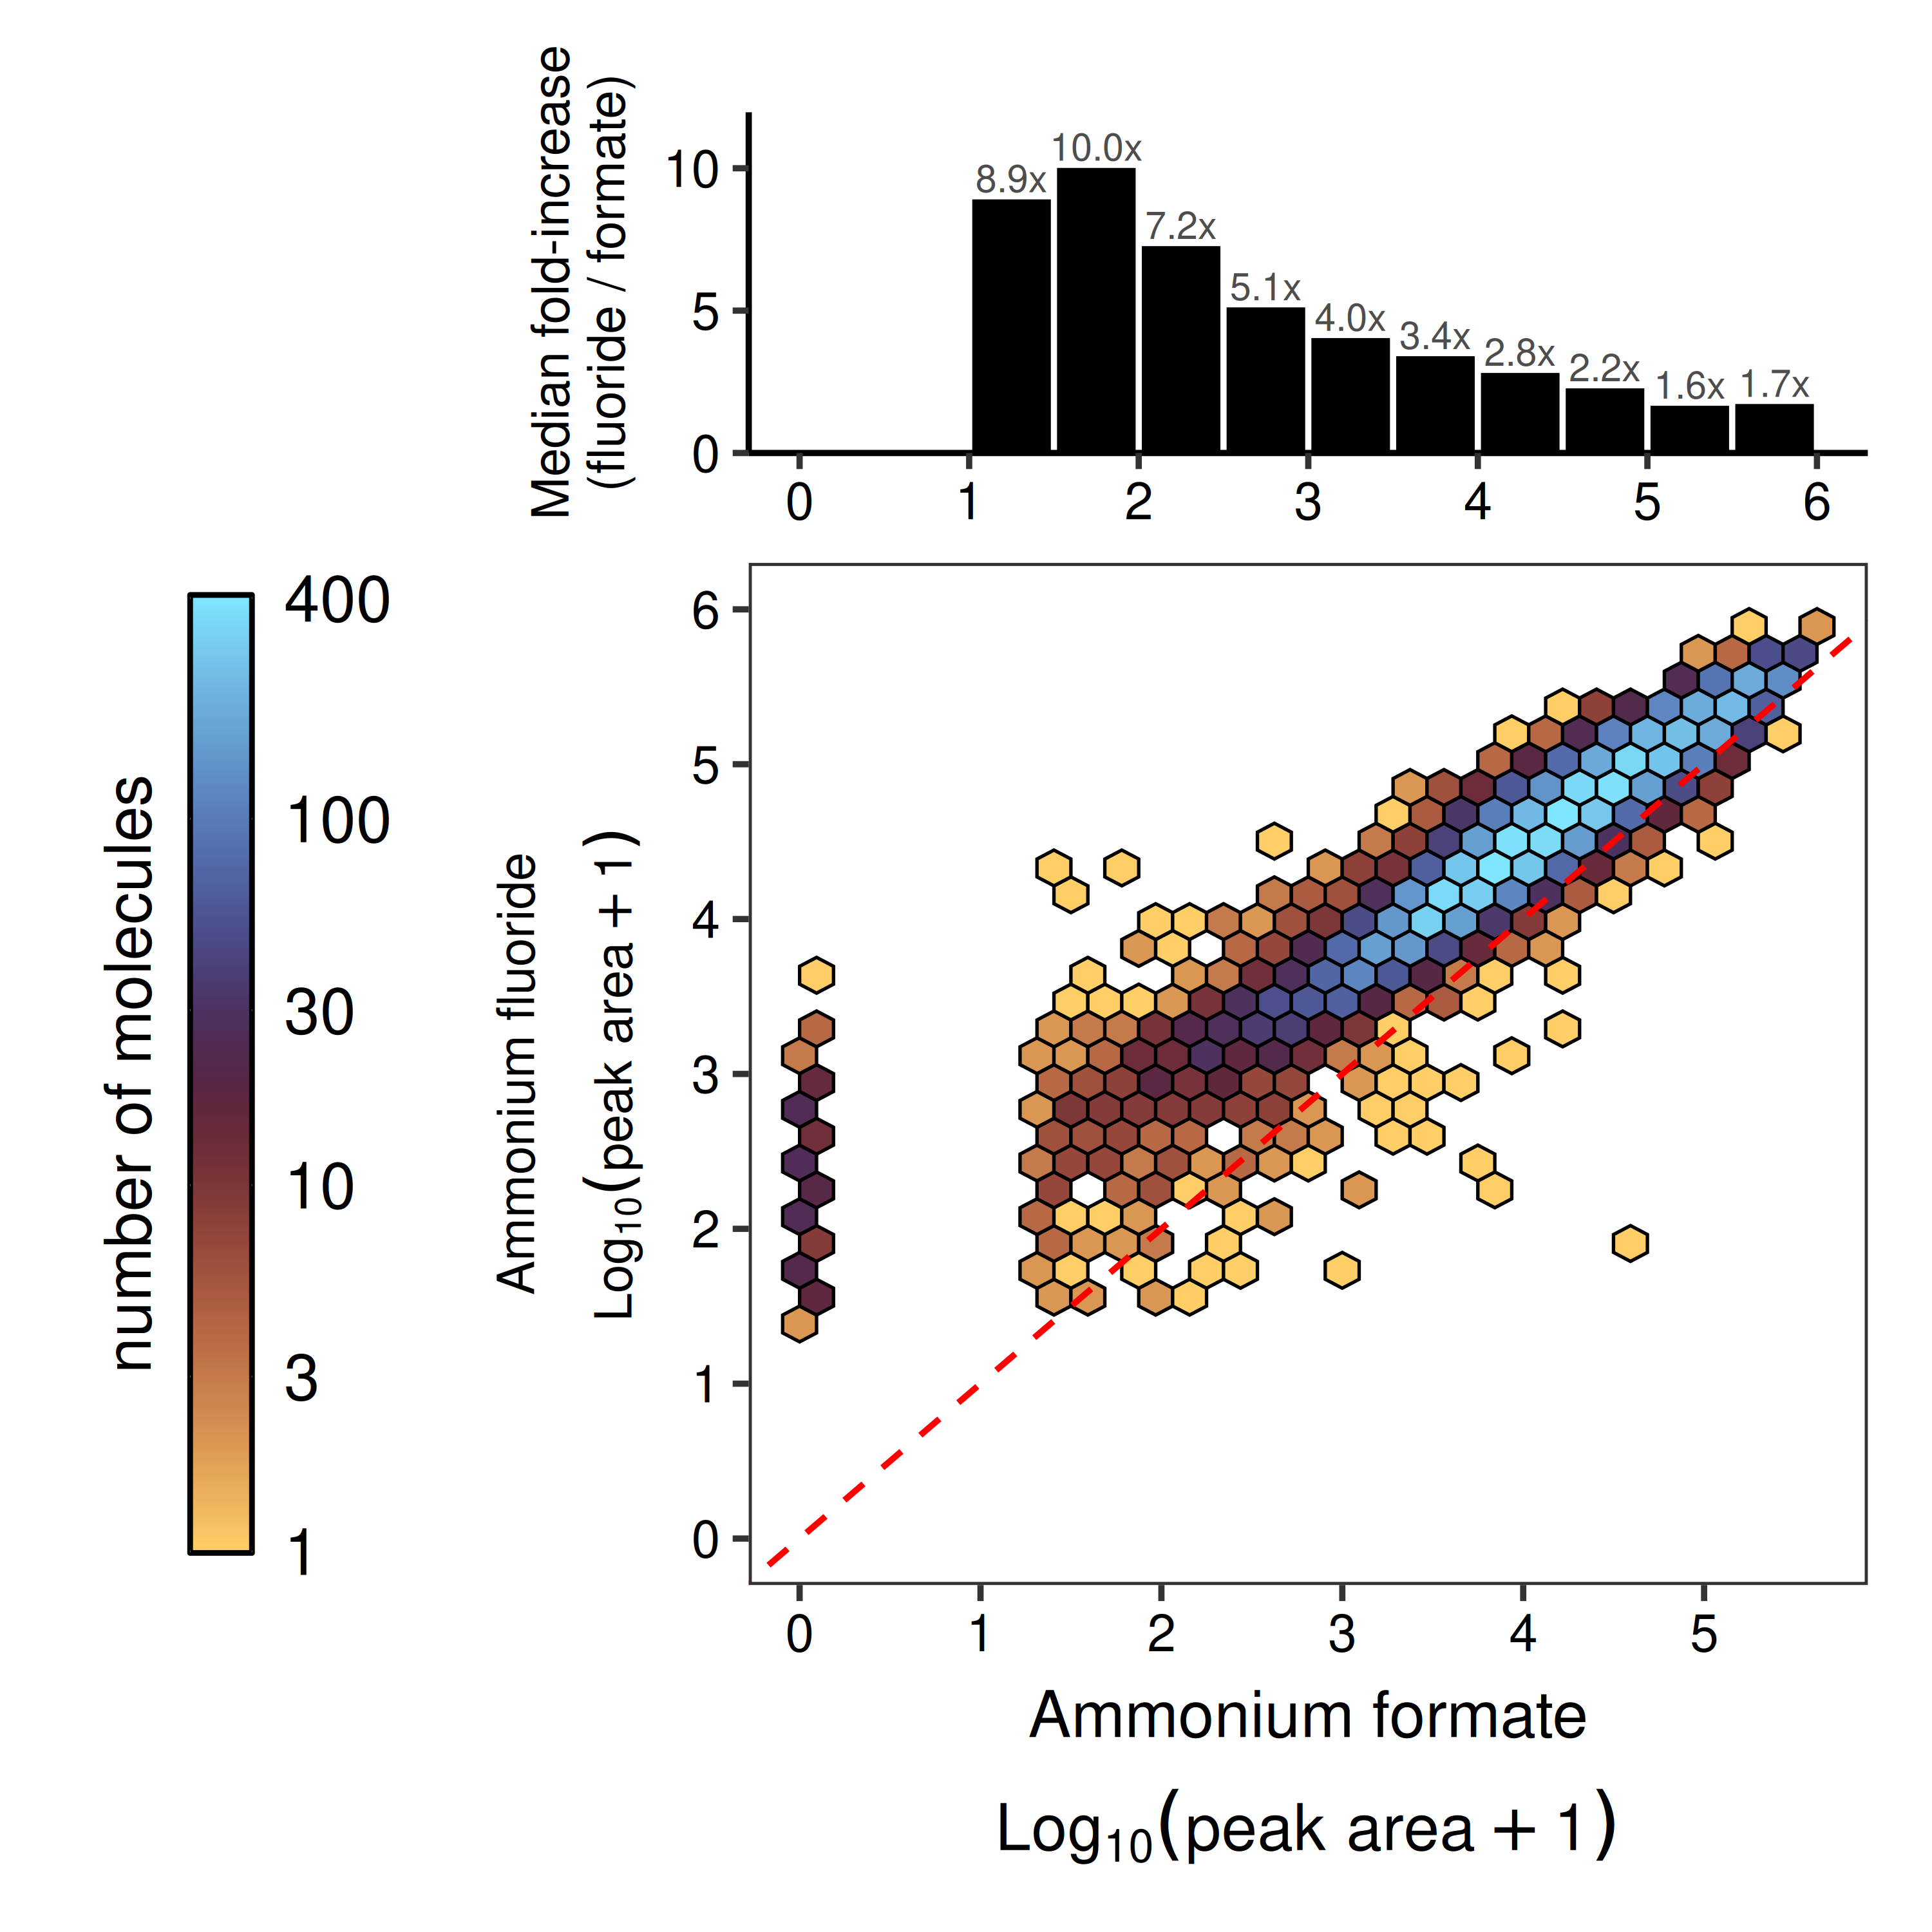
Figure 6: Improved chemical coverage through mobile-phase optimization. Hexbin density plot comparing log10 peak area for compounds measured via Echo-MS using carrier solvent (acetonitrile:methanol:water 80:10:10) supplemented with 5 mM ammonium formate (x-axis) vs 1 mM ammonium fluoride (y-axis) mobile phases. Red dashed line indicates y=x identity. Top panel shows the median fold-increase (fluoride/formate) binned by formate signal intensity, demonstrating improved detection across signal ranges.
What’s next?
Beyond the Tier 1 reactivity and inhibition screens described above, we are actively developing additional endpoints to profile CYP activity (Fig 7):
- CYP Clearance Assay: an automated, 2 µL 1536-well time-course reactivity assay to provide kinetic depth (Fig 7A).
- Time-Dependent Inhibition (TDI): Identifies inhibitors that grow more potent with sustained enzyme exposure, a critical DDI liability (Fig 7B).
Figure 7: Clearance & TDI assays
Figure 7: Characterization of CYP metabolic clearance and time-dependent inhibition (TDI) assays in 1536-well format. (A) Metabolic depletion curves for CYP3A4 substrates AdipoRon and Eletriptan across five starting concentrations (1.5–20 µM), measured by Echo-MS peak area over 120 minutes of CYP3A4 incubation. Points show individual replicates; lines are loess fits. (B) Time-dependent inhibition assessment. Left: Troleandomycin dose-response curves with (black) and without (grey) 30-minute CYP3A4 preincubation. Red shaded region and arrow highlight the pIC50 shift between conditions. Right: Interactive pIC50 shift estimates (mean ± 95% CI) for known TDI compounds (troleandomycin, azamulin, verapamil, diltiazem) and non-TDI controls. Dotted line indicates the 2-fold shift cutoff for TDI classification. Mouse over points to see underlying DRC curve shifts.
We plan to expand to additional CYP isoforms and scale to tens of thousands of molecules. As our datasets grow, we will launch a blind challenge with over 20,000 CYP reactivity and inhibition data points across >4 CYPs later in 2026, along with the nuclear receptors PXR and AHR.
Acknowledgements
The authors would like to acknowledge experimental data, analysis and scientific input contributed by Ana Lindahl, Lauren Orr and Ayesha Ghazali for this blog post.
This work was supported by funding from ARPA-H and the Astera Foundation.
We would also like to acknowledge technical support for our CYP assay development from SCIEX and Discovery Life Sciences.
Get Involved
Key to the success of the OpenADMET consortium is hearing from the broader community of ADMET and ML scientists, so tell us what matters: which endpoints (MetID? reactive metabolites?) should we prioritize next? What data formats would slot seamlessly into your model training? What experimental details are you most curious about? Join the conversation on the OpenADMET assay development Discord, or reach out to us directly .
Data Accessibility
Datasets are available in parquet format on HuggingFace. Blog post source code and assay protocols can be found on Github.
Last updated: March 03, 2026
Built with ❤️ and Quarto